As options expiration week approaches, the KOSPI index and its largest constituent stocks sometimes drop sharply for no apparent reason — no bad news, no negative catalyst. This has led many retail investors to suspect that "institutions and foreign investors are artificially manipulating the price." The indicator most often used to explain this kind of market move is called Max Pain.
Max Pain is the price at which individual options buyers suffer the greatest losses, while the institutions and foreign investors who write and sell those options collect the greatest profit. But institutions and foreign investors don't simply push the price down or up with brute trading volume. Instead, based on the flow of money already committed in the options market, a kind of "gravitational field" called Max Pain forms, and the price is naturally drawn to settle within it.
1. The Core Supply-Demand Indicator: Open Interest and Max Pain
To understand this mechanism, you first need to understand open interest — the most basic metric in the derivatives market.
What Is Open Interest?
Open interest is the total number of outstanding options contracts that investors have entered into and not yet sold or settled by expiration — in other words, positions that remain held. When open interest is concentrated at a specific strike price, it means a large amount of capital has taken and is holding a position at that price level, making open interest data clear, quantitative evidence of where market participants' capital is concentrated.
What Is Max Pain?
Max Pain is the strike price at which, when you tally up the open interest of every call option (a bet on a rise) and put option (a bet on a decline) in the market, options buyers (mostly retail investors) suffer the greatest loss while options sellers (mostly institutions and foreign market makers) maximize their premium income.
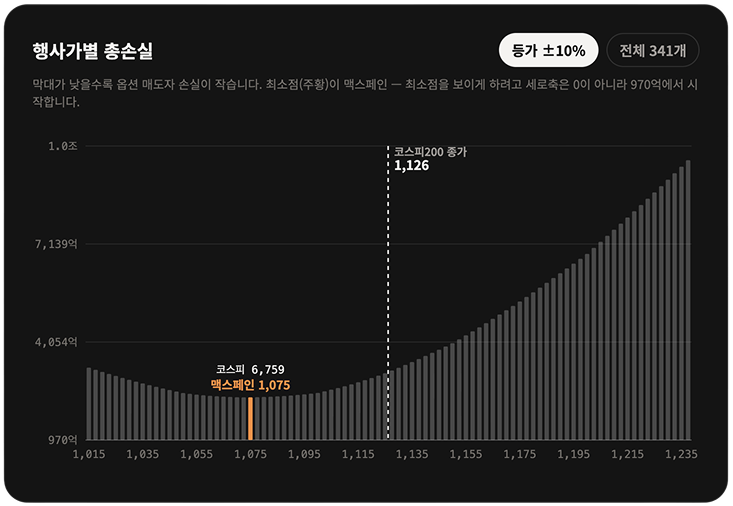
Institutions and foreign investors don't force the price down or up directly. Based on where open interest is concentrated, a supply-demand "field" called Max Pain forms, and through the market maker system, the price is naturally drawn to converge toward that point.
2. The Mechanism: Delta Hedging and Mean Reversion
The tendency for prices to gravitate toward the Max Pain price isn't the result of deliberate manipulation by large capital — it's a natural outcome of institutions' risk management systems at work. Because the derivatives market ends up moving the underlying cash market, this is often called the "wag the dog" effect.
Delta Hedging and Supply-Demand Alignment
Market makers (institutions and foreign investors) who sell options continuously trade KOSPI 200 cash-market stocks to eliminate the directional risk that arises when prices surge or plunge sharply in one direction. When the price rises, they buy the underlying stocks to neutralize their position; when it falls, they sell.
As expiration approaches, the constant flow of this hedging volume cushions market shocks near the Max Pain price and pulls the price back toward a stable equilibrium point.
A Checkpoint for Market Participants
Professional traders and quant algorithms regularly track KOSPI 200 open interest volume. Once open interest concentrates at a specific strike and Max Pain forms there, market participants treat that level as a key support or resistance zone and trade accordingly. Even without anyone deliberately steering the price, this shared awareness of the data creates a self-reinforcing flow of supply and demand that pulls the price in that direction.
3. How Max Pain Is Calculated from Open Interest Data
Max Pain isn't a subjective guess — it's an objective figure derived from data, calculated in four steps.
- Build the strike price database: List every strike price listed for KOSPI 200 index options.
- Aggregate all open interest: Tally the outstanding call and put contracts at every strike price that haven't been settled or closed out.
- Sum hypothetical intrinsic value: For every possible closing price X on expiration day, calculate the total hypothetical payout options buyers would collect.
- Find the minimum-loss zone: Identify the price at which the sum of options buyers' payouts is smallest — equivalently, where sellers' (institutions') profit is maximized. That price is Max Pain.
4. How 10Bagger Visualizes This Data
Understanding the theory doesn't help much if you have to run the calculation by hand every month at expiration. 10Bagger's KOSPI 200 Max Pain page automatically aggregates KOSPI 200 options open interest data every day, condensing this entire calculation into a single screen.
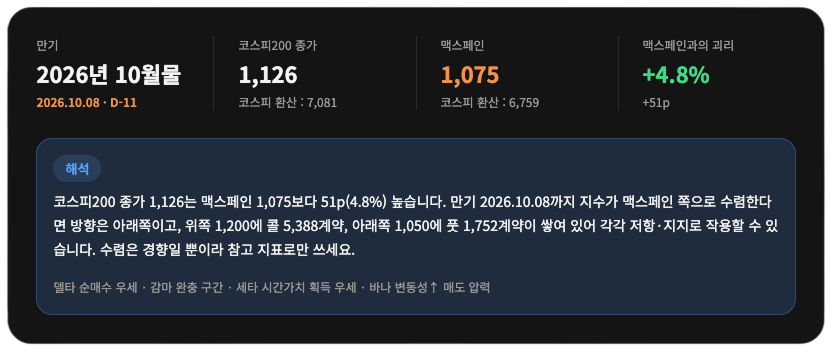
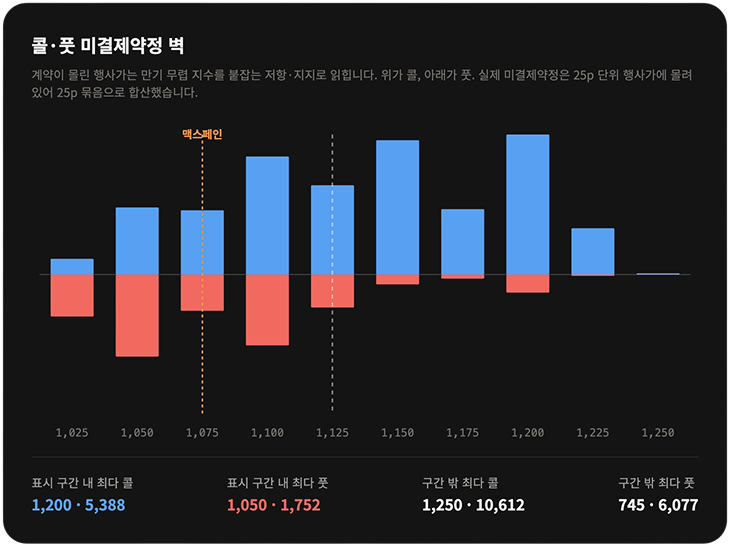
Max Pain & the Call/Put Open Interest Wall
A bar chart lets you compare call and put open interest piled up at each strike price at a glance. The more contracts concentrated at a given strike, the more likely that level is to act as a strong support or resistance zone as expiration nears. It shows the current KOSPI 200 close, the Max Pain price, and the gap between the two at a glance, and it also converts the price into KOSPI index terms — handy if you're timing an entry into large caps like Samsung Electronics or SK Hynix.
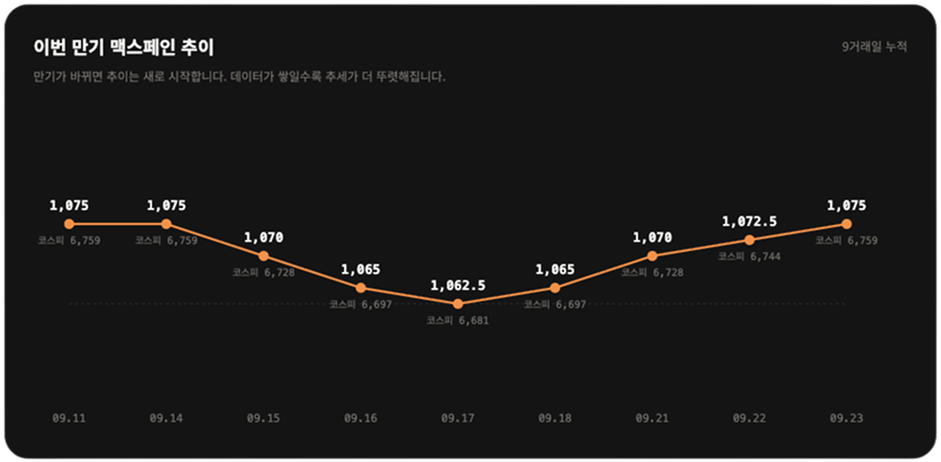
Max Pain Trend Chart
Max Pain isn't a fixed number. As new options contracts get written and existing positions get closed out, it shifts a little every day. Watching how the Max Pain price for the current expiration cycle has moved over time — rather than relying on a single snapshot — lets you track the broader trend and direction of supply and demand continuously.
Gamma, Delta, and Vanna Exposure
These are supplementary indicators showing which direction market makers who sold the options are positioned to hedge in right now. When gamma exposure sits in the "dampening" zone, market makers' hedging trades absorb price swings; in the "amplifying" zone, they instead add to volatility. Delta exposure shows whether market makers are tilted toward gains from a rising or falling index, while vanna exposure shows how that delta position would shift if volatility changes. This lets you go beyond just reading about the delta-hedging mechanism in theory and actually see, with data, the positions market makers are holding right now.
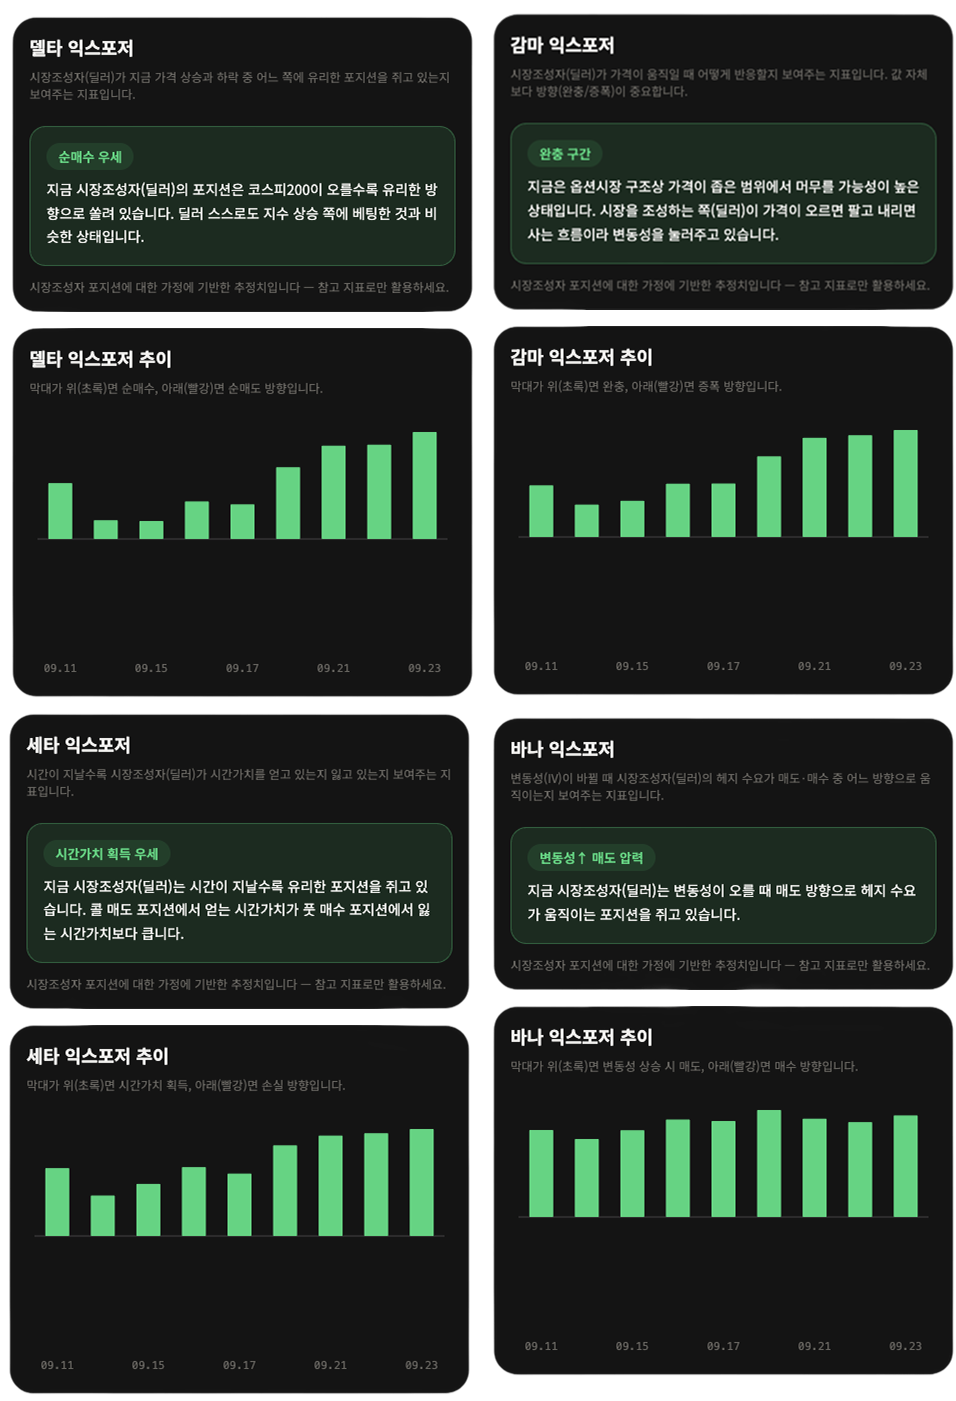
That said, gamma, delta, and vanna exposure are estimates based on assumptions about market maker positioning, so unlike Max Pain, they aren't a definitive figure. It's best to treat Max Pain and the open interest wall as your primary reference points, and use these exposure indicators to double-check the finer direction of supply and demand.
5. Practical Strategies
The biggest risk when analyzing derivatives-driven supply and demand is emotional guesswork. Max Pain isn't a signal that predicts an exact price — it should be used as an objective gauge of which direction supply and demand are being distorted during expiration week.
Diagnosing Upward or Downward Pressure During Expiration Week
If the KOSPI index or a large-cap stock is trading well above the Max Pain price, downward pressure becomes more likely as expiration approaches, as institutions unwind risk-management sell positions. Conversely, if the current price is well below Max Pain, you should factor in the possibility of a rebound in demand.
Managing Volatility Risk Based on the Gap
The farther the current price sits from the Max Pain price (the "gap"), the greater the price volatility is likely to be during expiration week. Chasing the price aggressively in this environment is risky. The more level-headed approach is to enter only after confirming the price has converged toward Max Pain and volatility has eased.
Timing Cash-Market Entries
If you're planning to buy a KOSPI large cap like Samsung Electronics or SK Hynix outright, be cautious when the Max Pain price sits below the current price. It's safer to time your entry for right after expiration, once derivatives-driven sell pressure has fully worked its way through the market.
6. Limitations and Caveats
Macro Shocks Take Priority
When a major macro event hits — a Bank of Korea or Fed rate decision, a geopolitical shock, or earnings that badly miss expectations — the derivatives-driven supply-demand structure breaks down entirely. When a macro shock is stronger than positioning-driven flows, the price will break straight through the Max Pain level and continue trending.
Open Interest Changes in Real Time
Open interest isn't a static number. As new contracts get written and existing ones get closed out intraday, the Max Pain price shifts along with it. Rather than relying on a single check, you should track supply and demand continuously.
Liquidity Limits
Max Pain doesn't apply to small and mid-cap stocks with little to no derivatives trading. It only works reliably for the KOSPI 200 index and Korea's largest, most liquid large-cap stocks.
7. Conclusion
The tendency for prices to revert to a specific level on options expiration day isn't a vague conspiracy or price manipulation — it's the direct result of supply and demand shaped by open interest data.
There's no need to view this kind of market volatility with vague anxiety or suspicion. Calmly monitoring objective supply-and-demand indicators like open interest and Max Pain is the most reliable way to avoid getting shaken out by expiration-week illusions and to stick to your own trading discipline.
Check Max Pain on 10Bagger, and build your own trading discipline around the data.