
As options expiration week approaches, we often see the KOSPI index and top market-cap mega-cap stocks suddenly plunge without any specific negative or positive news. Because of this, retail investors often raise conspiracy theories that "institutions and foreign investors are artificially manipulating stock prices." A representative indicator that explains these market movements is called Max Pain (Maximum Pain Point).
Max Pain refers to the price at which option buyers (mostly retail investors) suffer the largest loss, while option issuers and sellers (institutions and foreign investors) achieve maximum profits. However, institutions and foreign investors do not simply drag down or pump stock prices through raw volume. Instead, based on the capital flows in the options market, they set up a supply-and-demand "playing field" known as Max Pain and guide stock prices to naturally settle within that field.
1. Key Supply and Demand Indicators: Open Interest and Max Pain
To easily understand this mechanism, one must first learn about "Open Interest," the most fundamental indicator in the derivatives market.
What is Open Interest?
In the derivatives market, it refers to the "total remaining option contracts" held by investors after opening new positions, without selling or closing them prior to the expiration date. In short, it represents un-settled, active positions. A concentration of open interest at a specific strike price indicates that massive capital is waiting at that price level, providing clear quantitative evidence to forecast future supply and demand flows.
What is Max Pain?
By analyzing the open interest volume of all call options (bullish bets) and put options (bearish bets) formed in the market, it is the strike price at which option buyers (mostly retail investors) suffer the greatest financial loss, allowing option sellers (mostly institutional and foreign market makers) to maximize their premium income.
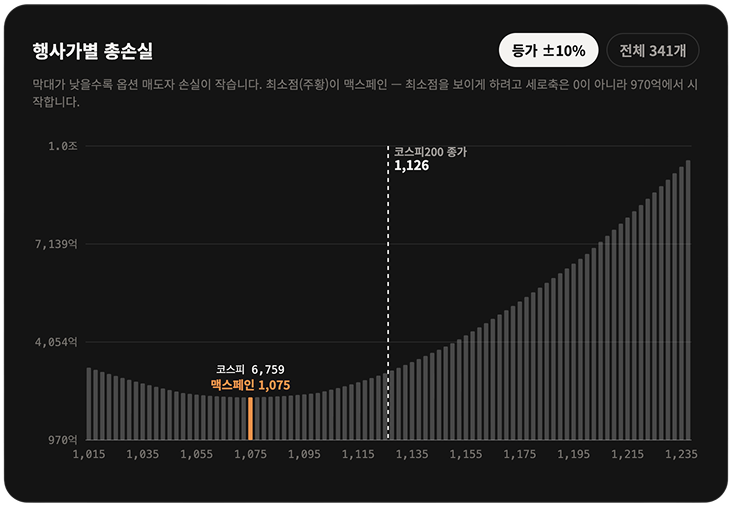
Institutions and foreign investors do not push stock prices up or down purely through brute force. Based on zones with dense open interest, they establish a supply-and-demand framework called Max Pain, using market maker systems to encourage stock prices to naturally converge toward that point.
2. Supply-and-Demand Guidance Mechanism: Delta Hedging and Mean Reversion
The phenomenon of stock prices being pulled toward the Max Pain price is not caused by big capital forcibly manipulating stock prices. It is a natural outcome that occurs as institutional risk management systems operate. This is often referred to as the "Wag the Dog" phenomenon, meaning the derivatives market wags the underlying cash stock market.
Supply and Demand Balancing via Delta Hedging
Market makers (institutions and foreign investors) who sell options continuously trade KOSPI 200 cash stocks to eliminate directional risk that arises when stock prices surge or plunge in one direction. When stock prices rise, they buy cash stocks to neutralize their position; when stock prices fall, they sell cash stocks.
As the options expiration date draws near, the inflow and outflow of these hedge orders serve to buffer market shocks near the Max Pain price level and pull stock prices back toward a stable equilibrium point.
Supply and Demand Checkpoints for Market Participants
Professional traders and quantitative algorithms analyzing data periodically check KOSPI 200 open interest figures. When open interest concentrates at a specific strike price to form Max Pain, market participants view that point as a key support or resistance level and utilize it in their trading. Even without major players directly manipulating stock prices, trading flows from data-checking investors naturally overlap, completing the phenomenon of prices converging in that direction.
3. Open Interest Data-Based Max Pain Calculation Logic
Max Pain is not a subjective guess; it is an objective figure derived from data. The calculation goes through four main steps:
- Construct Listed Strike Price Database: List all strike prices set for KOSPI 200 index options.
- Aggregate Total Open Interest: Count all remaining unclosed call and put option contracts for each strike price.
- Sum Simulated Intrinsic Value: Calculate hypothetically across all price levels what the total payout to option buyers would be if the index closes at price X on expiration day.
- Identify Minimum Loss Point: Find the price level where the sum of option buyers' profits is at its lowest (i.e., where institutional sellers maximize their payouts). This price is Max Pain.
4. Supply & Demand Data Visualization and Indicator Interpretation
Even if you understand the theory, it is difficult for individual investors to manually calculate complex formulas every month ahead of expiration. 10Bagger KOSPI 200 Max Pain automatically aggregates KOSPI 200 options open interest data daily, providing a single-screen, at-a-glance view of this complex calculation process.
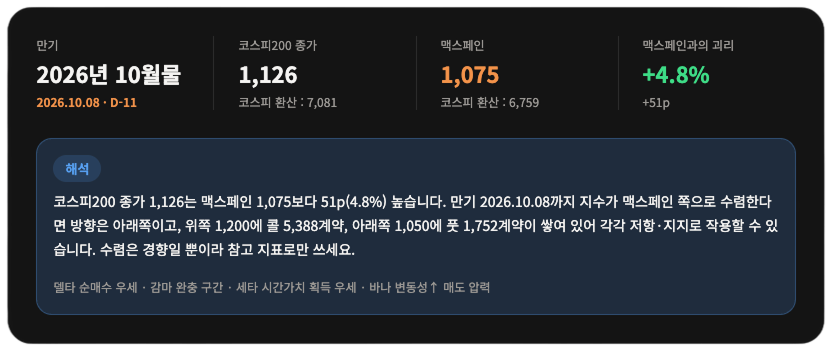
Max Pain & Call/Put Open Interest Walls
You can easily compare call and put open interest stacked by strike price using a bar chart. The more contracts concentrated at a specific strike price, the higher the likelihood that price level will act as a strong support or resistance wall anchoring the index near expiration. It intuitively displays the current KOSPI 200 closing price, Max Pain price, and the disparity rate between the two. Converted KOSPI index prices are also provided, which can be immediately referenced when timing entries into mega-cap stocks like Samsung Electronics or SK Hynix.
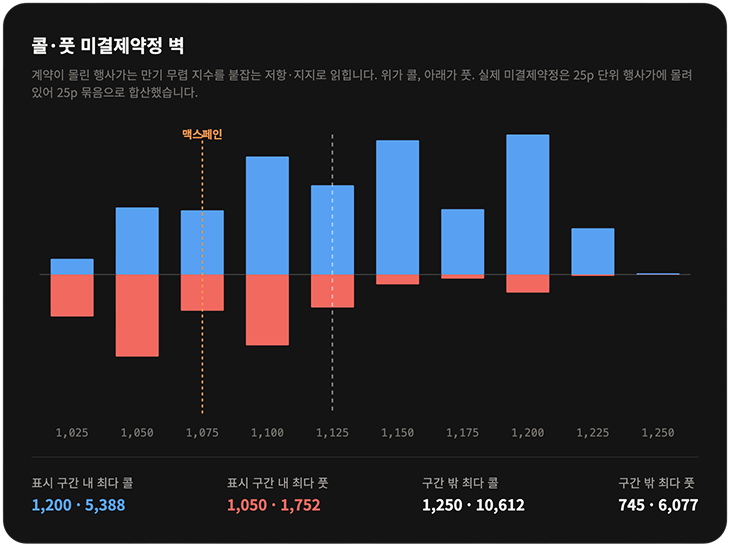
Max Pain Trend Chart
Max Pain is not a static number. It shifts slightly every day as new option contracts are opened and existing positions are liquidated. By tracking how the Max Pain price for the current expiration cycle moves over time, you can continuously monitor the overall flow and direction of supply and demand without relying on a single snapshot.
Gamma, Delta, and Vanna Exposure
These are supplementary indicators showing which direction market makers (dealers) who sold options are currently prepared to unload hedge volume. When Gamma exposure is in a buffer zone, dealer hedging trades absorb stock price volatility; when in an amplification zone, it works in reverse to expand volatility. Delta exposure measures whether dealer positions lean toward index rises or drops, while Vanna exposure measures how Delta positions shift in response to changes in volatility. Rather than just understanding the Delta Hedging mechanism conceptually, you can directly verify the actual position status held by dealers using data.
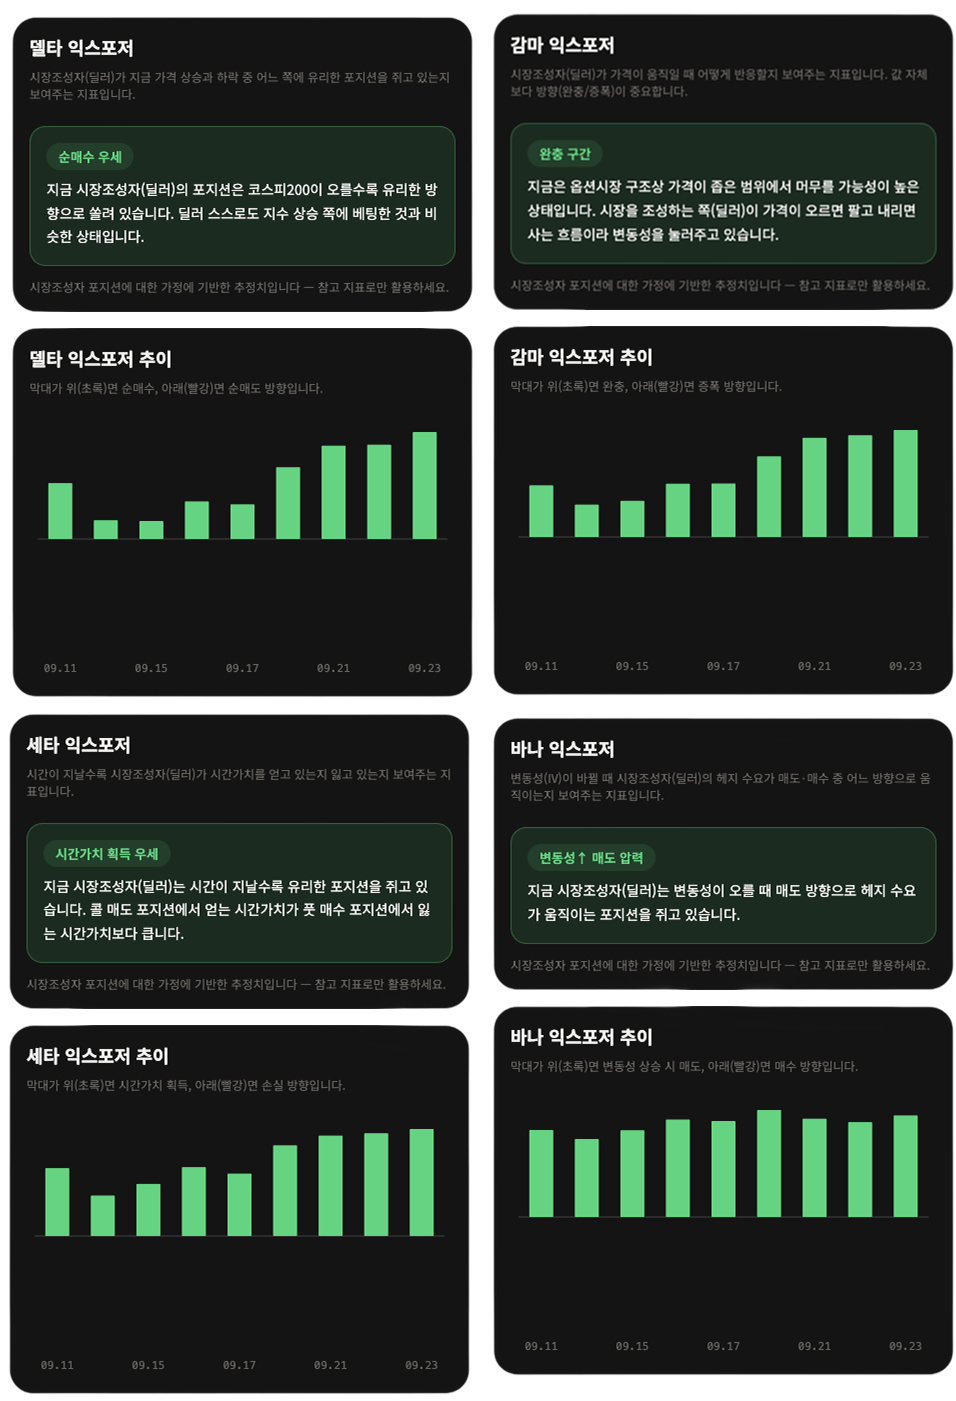
Note that Gamma, Delta, and Vanna exposures are estimated market model projections of dealer positions, so they are not definitive quantitative figures like Max Pain. Therefore, a useful approach is to take Max Pain and the Open Interest Wall as your primary baseline and use these exposure metrics to complementarily inspect the detailed directional nuance of supply and demand.
5. Practical Trading Strategies
The main trap to avoid when analyzing derivatives supply and demand is emotionally driven speculation. Max Pain should not be treated as a predictive signal that definitively guesses a specific stock price, but as an objective metric to measure how supply and demand are being distorted during options expiration week.
Diagnosing Upward and Downward Pressure During Expiration Week
If the current KOSPI index or mega-cap stocks are trading significantly above the Max Pain price, downward pressure is likely to mount as expiration approaches due to institutional risk management selling. Conversely, if the current price is far below Max Pain, you should factor in the potential for buying flows seeking a rebound.
Managing Volatility Risk Based on Disparity Rate
The greater the distance (disparity rate) between the current price and the Max Pain price, the higher the stock price volatility during expiration week. Chasing momentum under these conditions is risky. A cool-headed strategy is to wait and enter after confirming that price volatility compresses as the stock price converges near Max Pain.
Identifying Cash Stock Entry Timing
If you plan to buy KOSPI mega-cap stocks like Samsung Electronics or SK Hynix in the spot/cash market, caution is required when the Max Pain price is below the current stock price. It is safer to time your buys right after options expiration passes and selling pressure originating from the derivatives market is fully digested.
6. Analytical Limitations and Precautions
Dominance of Powerful Macro Shocks
When massive macro events erupt—such as interest rate decisions by the Bank of Korea or the Fed, geopolitical risks, or corporate earnings surprises far exceeding market estimates—the derivatives supply-and-demand structure breaks down completely. When macroeconomic shocks outweigh supply and demand dynamics, stock prices break through the Max Pain price line and push forward according to the macro trend.
Real-Time Variability of Open Interest
Open interest is not a static number. As new contracts are opened or existing positions closed during trading hours, the Max Pain price level also shifts slightly. Therefore, you should continuously track supply and demand rather than relying on a single inquiry.
Liquidity Limitations
Max Pain cannot be applied to small- and mid-cap stocks with virtually no derivatives trading. It functions effectively only for the highly liquid KOSPI 200 Index and top domestic mega-cap stocks by market capitalization.
7. Conclusion
The phenomenon of stock prices reverting to a specific level on options expiration day is not vague conspiracy or price manipulation, but a supply-and-demand result generated by open interest data.
There is no need to view market volatility as vague anxiety or conspiracies. Checking and monitoring objectively existing supply and demand indicators like Open Interest and Max Pain is the surest foundation to stay grounded in your trading principles without being misled by illusions during expiration week.
We hope you check Max Pain on 10Bagger and build your own robust trading principles.